How Index Funds Distort Markets
Market-capitalization-weighted index funds are the bedrock of modern passive investing. The logic is simple and powerful: buy the entire market, hold it, and let the magic of compounding do the work. But what happens when trillions of dollars follow this same simple logic, persistently buying stocks merely because they are big? This post explores a simple theory that reveals the profound, market-distorting consequences of this massive, price-agnostic flow of capital. We’ll show how a single, physically-motivated assumption about market liquidity can predict the emergence of a structural “alpha” and a warped “beta,” creating a predictable class of winners and losers.
The Core Assumption: Liquidity Scaling
The theory rests on a single, intuitive idea: a stock’s ability to absorb capital without its price moving wildly—its market liquidity—does not grow as fast as its size. We can model this with a simple power law. The price impact (), or the percentage price change per dollar of inflow for a stock , is related to its market capitalization () by:
Here, is a market friction constant, and is the crucial liquidity scaling exponent. This single parameter governs everything. The key insight is that if market liquidity grows more slowly than market capitalization, then . As we will see, this simple condition is all that’s required to create significant market distortions.
The Fundamental Dynamic Equation
From this one assumption, we can derive the equation of motion for any stock in the index. A stock’s return () is simply the product of its price impact () and the capital it receives. In a market-cap index, the inflow to a stock is its weight () times the total fund inflow ().
Putting it all together:
This simplifies to the fundamental equation for the growth of a component’s market cap, the workhorse of our theory:
The Consequences: Warped Beta and Structural Alpha
This simple dynamic equation has two major consequences for investors, altering the traditional landscape of risk and return.
Flow-Driven Beta ()
Beta measures a stock’s sensitivity to the overall market’s movement. In a world dominated by passive flows, a component of beta emerges that has nothing to do with fundamentals and everything to do with size. This “flow-driven beta” is defined as the ratio of the stock’s return to the market’s return. Using our dynamic equation, we can derive a closed-form solution:
The takeaway is clear. When , the exponent is positive. This means that as a company’s capitalization gets larger, its flow-driven beta gets larger. The passive flow mechanism makes large-cap stocks systematically more aggressive () and small-cap stocks more defensive (), regardless of their underlying business.
Structural Alpha ()
Alpha is the excess return of an asset over its beta-adjusted required return. In our deterministic model, it’s the excess return over the market index. A component’s alpha () is its instantaneous rate of excess return:
Substituting our expressions for the rates of change yields the solution for structural alpha:
This formula reveals a predictable and persistent alpha spread. The term in the parenthesis is the difference between the component’s scaled size () and the market-wide average of that same metric. When , larger firms will have a value greater than the average, resulting in a predictable positive alpha. Conversely, smaller firms will have a predictable negative alpha. This isn’t outperformance based on skill; it’s a structural transfer of value from smaller components to larger ones, driven entirely by the mechanics of market-cap indexing.
A Testable Prediction
This theory isn’t just a thought experiment; it makes sharp, testable predictions. One of the most elegant tests is to look at the ratio of betas for any two stocks, and . The complicated market-wide sum in the beta formula cancels out perfectly:
Taking the logarithm of both sides gives a linear relationship:
This provides a clear hypothesis: if you plot the log-ratio of observed historical betas against the log-ratio of market caps for pairs of stocks, you should see a straight line. The slope of that line gives you a direct estimate of , telling you the strength of this market-distorting effect.
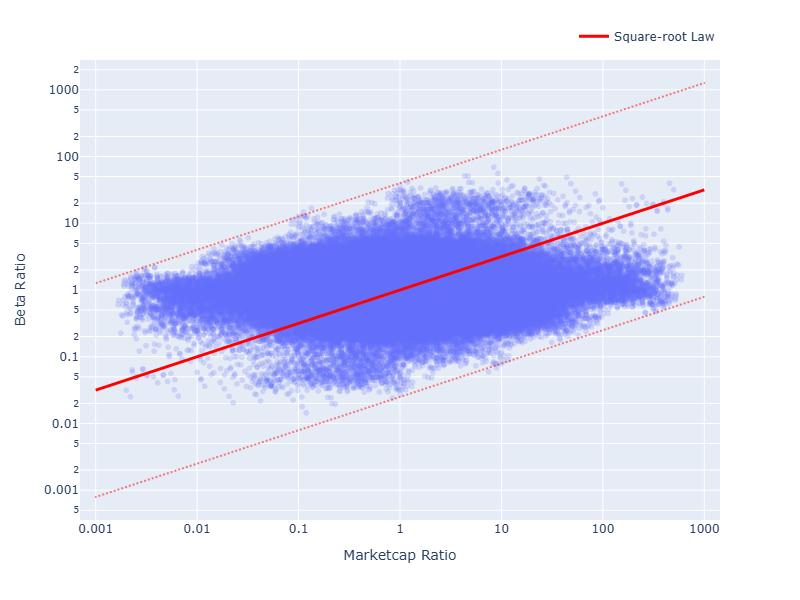 Figure 1: Log-ratio of betas vs. log-ratio of market caps for all pairs of stocks in the S&P 500. We use data from Yahoo Finance. This is a noisy measurement as ETF flow is not the only market force that determines the beta. However the square-root law seems to capture the broad trend of the data.
Implications for Investors
The theory has direct, actionable implications for all market participants.
For Active Managers
The existence of a predictable, structural alpha spread is an opportunity. An active manager can construct a market-neutral portfolio that goes long the large-cap stocks with positive predicted alpha and short the small-cap stocks with negative predicted alpha. By design, this strategy is uncorrelated with the market and systematically harvests the value being transferred from structurally disadvantaged to structurally advantaged companies.
For Passive Investors
The model serves as a profound warning: “passive” investing is not a neutral act. Over-reliance on market-cap-weighted indices creates systemic risks.
- It is an implicit bet on momentum and concentration. This exposes your portfolio to massive idiosyncratic risk from a few mega-cap stocks.
- It erodes diversification. As the index concentrates, the benefits of holding a “basket” of stocks diminish.
Prudent passive investors should consider augmenting their core holdings with strategies that break this feedback loop, such as equal-weight, fundamental, or capped-weight indices.
Conclusion
Derived from a single assumption about market liquidity, this theory paints a concerning picture. Persistent, price-agnostic inflows into market-cap-weighted indices do not simply reflect the market; they actively shape it. This mechanism inevitably leads to market concentration, a size-based distortion of risk (beta), and the emergence of a predictable alpha spread. These are not market anomalies, but the direct, mathematical consequence of the indexing mechanism itself. It provides a new lens to understand market dynamics and offers clear strategies for both active managers seeking to generate alpha and passive investors seeking to preserve true, long-term diversification.